
Sign up for periodic reports and bulletins

Bill Sardi
the vitamin supplement answer man
FREE access; FREE of commercials; FREE to use
Sign up for periodic reports and bulletins
FREE access; FREE of commercials; FREE to use
Posted May 5, 2020: by Bill Sardi
While fact-checker websites SNOPES and BUZZFEED NEWS dismiss any idea that the CDC’s newly issued death count from COVID-19 infections is inaccurate, all data issued from the CDC based on daily and weekly estimates are issued with the caveat that they represent provisional (incomplete) data that is subject to change because of late reporting of death certificates.
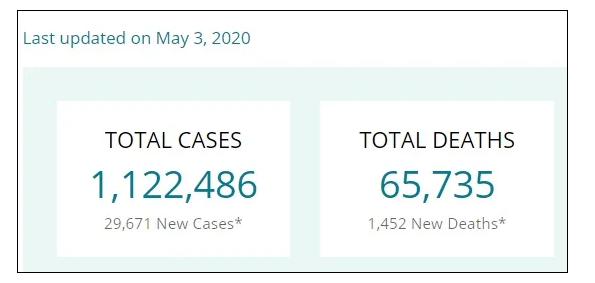
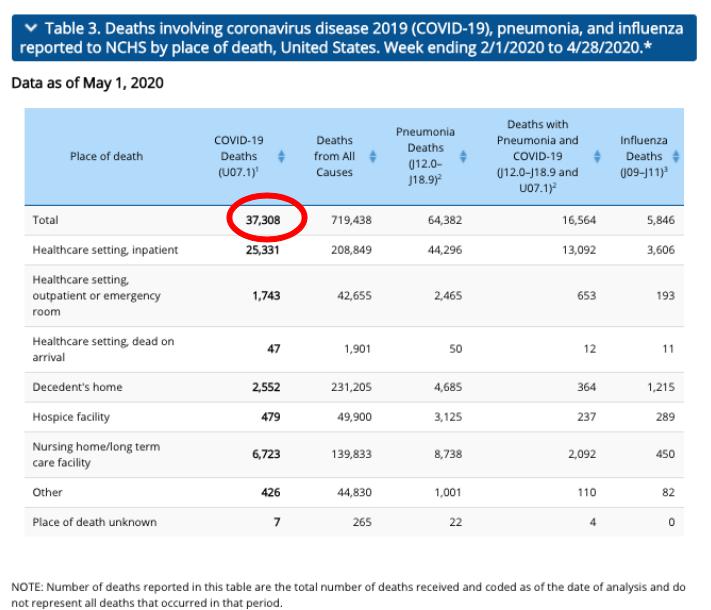
What is raising a storm is that the 65,735 COVID-19 deaths listed by the CDC on its DAILY count does not match up with more accurate WEEKLY COVID-19 death estimate of 37,308 as of the week ending April 25 (see below).
SNOPES says the “large discrepancy” is explained by the “About The Data” fine print section that explains the numbers are preliminary and include “both confirmed and probably deaths.” SNOPES misleadingly says: “This claim is like comparing stock prices from a two-week-old newspaper with those offered today by a cable news station, and then attributing any differences to a conspiracy rather than the mere passage of time as reflected in more current reporting.” No! The two-week data includes more data and agencies have had more time to verify death certificates.
A reporter with BUZZFEED NEWS also makes the same mistake, denying the CDC revised the death count downward.
As of Monday, May 4, major news agencies continue to use the sixty-thousand-plus death figures.
More than 67,000 COVID-19-related deaths have been recorded. – CNN May 4, 2020
The novel coronavirus has already claimed the lives of more than 61,000 Americans but experts fear that number could be far higher…”. – ABC News, April 30, 2020
The level of accuracy in reporting case and death figures is mired by late reporting. The CDC says:
“Currently, 63% of all U.S. deaths are reported within 10 days of the date of death, but there is significant variation among jurisdictions. It takes extra time to code COVID-19 deaths. While 80% of deaths are electronically processed and coded by National Center for Health Statistics within minutes, most deaths from COVID-19 must be coded manually, which takes an average of 7 days. Other reporting systems use different definitions or methods for counting deaths.”
It is upon this specious data that Americans are held captive in an unprecedented lockdown that has one of the nation’s leading virologists who is a CDC/White House spokesperson saying those parties who violate the lockdown “will feel guilty for the rest of their lives… if they go home and infect their grandmother or grandfather who has a co-morbid condition and they have a serious or a very unfortunate outcome.”
In Congressional testimony on March 11 Dr. Anthony Fauci, director of the National Institute of Infectious Diseases, said the current coronavirus is “10 times more lethal than the seasonal flu.”
On other occasions Dr. Fauci has uttered more reserved estimates saying COVID-19 may ultimately produce deaths more like the seasonal flu. But again on March 26 Dr. Fauci was quoted to say: “The mortality of [COVID-19] is about 10 times [the flu].”
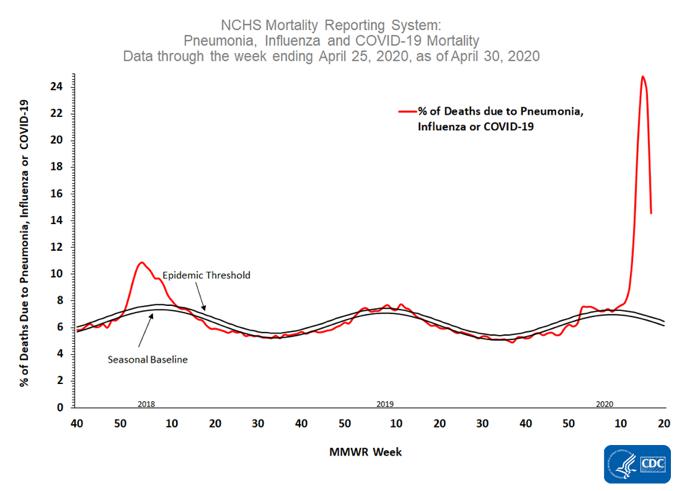
But as presented in the latest weekly data issued by the CDC, influenza deaths were far greater than COVID-19 deaths until the CDC changed the death count data on April 14 to include both laboratory-confirmed and probable deaths (see chart below). You can see the COVID-19 deaths then rise to implausible highs. The final weekly tally of 4/25/2020 shows a dramatic drop in COVID-19 deaths, while the virologists continue to maintain millions of lives are at risk and the lockdown must continue into summer.
(Cases only reflect quantity of testing; deaths are better indication of trends)
DATA.CDC.gov
| Week ending |
TOTAL ALL DEATHS |
COVID-19 Deaths |
Pneumonia Deaths | Pneumonia + COVID-19 Deaths |
Influenza Deaths |
|---|---|---|---|---|---|
| 2/01/2020 |
57,266 |
0 |
3,688 |
0 |
469 |
| 2/08/2020 |
57,615 |
1 |
3,672 |
0 |
494 |
| 2/15/2020 |
56,878 |
0 |
3,693 |
0 |
517 |
| 2/22/2020 |
56,806 |
0 |
3,557 |
0 |
536 |
| 2/29/2020 |
56,843 |
5 |
3,626 |
3 |
619 |
| 3/7/2020 |
56,212 |
25 |
3,719 |
14 |
583 |
|
AS OF APRIL 14, 2020, CDC DEATH COUNTS INCLUDE BOTH CONFIRMED & PROBABLE DEATHS* |
|||||
| 3/14/2020 |
53,968 |
49 |
3,676 |
25 |
578 |
| 3/21/2020 |
53,979 |
493 |
4,150 |
226 |
496 |
| 3/28/2020 |
57,430 |
2,712 |
5,624 |
1,235 |
410 |
| 4/4/2020 |
64,313 |
8,082 |
8,724 |
3,875 |
432 |
| 4/11/2020 |
66,577 |
12,262 |
9,841 |
5,468 |
430 |
| 4/18/2020 |
55,062 |
10,408 |
7,606 |
4,402 |
215 |
| 4/25/2020 |
26,489 |
3,271 |
2,806 |
1,316 |
67 |
|
37,308 |
64,382 |
16,564 |
5,846 |
||
*As of April 14, 2020, CDC case counts and death counts include both confirmed and probable cases and deaths. A confirmed case or death is defined by meeting confirmatory laboratory evidence for COVID-19. A probable case or death is defined by one of the following:
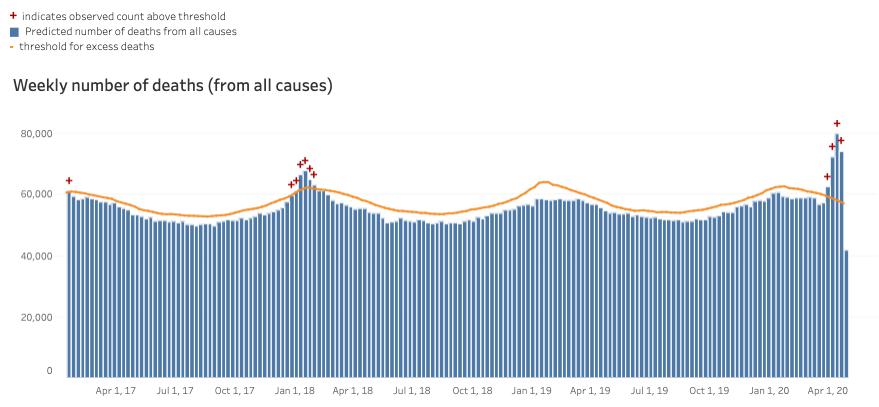
The following graphic shows the number of excess deaths in the U.S. has only exceeded predictions twice in the past four years (2017-2020) and by April 1 of 2020 had reached a four-year low point (see chart below).
Number of deaths reported on this page are the total number of deaths received and coded as of the date of analysis and do not represent all deaths that occurred in that period. Data are incomplete because of the lag in time between when the death occurred and when the death certificate is completed, submitted to NCHS and processed for reporting purposes. This delay can range from 1 week to 8 weeks or more
Posted in Coronavirus ; No Comments »
11
17
52
95
14
24
237
6
56
43
10
116
15
66
105